
Netdata is a system monitoring system, designed to be distributed, lightweight, flexible and open source. The application is able to detect hundreds of metrics automatically, simplifying their configuration and integration.
1.Installation
a. Login to CWP Pro server as the root user.
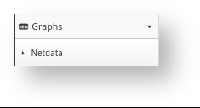
b. Click on the Graphs in the left bottom of the interface and select Netdata as in the screenshot below.
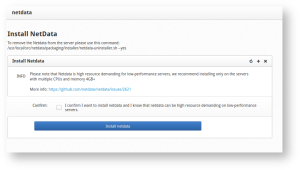
c. You will get a page as below from where you can install Netdata in the server, click on Install netdata.
d. After installation completes, you get the following page:
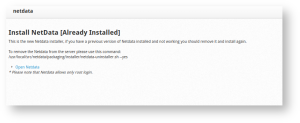
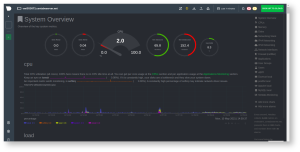
e. Click on Open Netdata , you need to enter the server root credentials to log in when prompted for it, then you get the following Netdata monitoring interface where you can see all the available services and their monitoring status.
2. Alarm Email notifications
The exec line in health configuration defines an external script that will be called once the alarm is triggered. The default script is alarm-notify.sh. You can change the default script globally by editing /etc/netdata/netdata.conf file.
Health config
[health]
# silencers file = /var/lib/netdata/health.silencers.json
# enabled = yes
# default repeat warning = never
# default repeat critical = never
# in memory max health log entries = 1000
# script to execute on alarm = /usr/libexec/netdata/plugins.d/alarm-notify.sh
# stock health configuration directory = /usr/lib/netdata/conf.d/health.d
# health configuration directory = /etc/netdata/health.d
# enable stock health configuration = yes
# rotate log every lines = 2000
# run at least every seconds = 10
# postpone alarms during hibernation for seconds = 60
alarm-notify.sh is capable of sending notifications.
It uses roles. For example sysadmin, webmaster, dba, etc. Each alarm is assigned to one or more roles, using the to line of the alarm configuration. Then alarm-notify.sh uses its own configuration file /etc/netdata/health_alarm_notify.conf. To edit it on your system, run /etc/netdata/edit-config health_alarm_notify.conf and find the destination address of the notification for each method.
Configuration
Edit /etc/netdata/health_alarm_notify.conf by running /etc/netdata/edit-config health_alarm_notify.conf. All notification methods except email, require some configuration (i.e. API keys, tokens, destination rooms, channels, etc).
Recipients per role per notification methods:
Notification
[root@vmi553071 ~]# grep sysadmin /etc/netdata/health_alarm_notify.conf
role_recipients_email[sysadmin]=”${DEFAULT_RECIPIENT_EMAIL}”
role_recipients_hangouts[sysadmin]=”${DEFAULT_RECIPIENT_HANGOUTS}”
role_recipients_pushover[sysadmin]=”${DEFAULT_RECIPIENT_PUSHOVER}”
role_recipients_pushbullet[sysadmin]=”${DEFAULT_RECIPIENT_PUSHBULLET}”
role_recipients_telegram[sysadmin]=”${DEFAULT_RECIPIENT_TELEGRAM}”
role_recipients_slack[sysadmin]=”${DEFAULT_RECIPIENT_SLACK}”
role_recipients_alerta[sysadmin]=”${DEFAULT_RECIPIENT_ALERTA}”
role_recipients_flock[sysadmin]=”${DEFAULT_RECIPIENT_FLOCK}”
role_recipients_discord[sysadmin]=”${DEFAULT_RECIPIENT_DISCORD}”
role_recipients_hipchat[sysadmin]=”${DEFAULT_RECIPIENT_HIPCHAT}”
role_recipients_twilio[sysadmin]=”${DEFAULT_RECIPIENT_TWILIO}”
role_recipients_messagebird[sysadmin]=”${DEFAULT_RECIPIENT_MESSAGEBIRD}”
role_recipients_kavenegar[sysadmin]=”${DEFAULT_RECIPIENT_KAVENEGAR}”
role_recipients_pd[sysadmin]=”${DEFAULT_RECIPIENT_PD}”
role_recipients_fleep[sysadmin]=”${DEFAULT_RECIPIENT_FLEEP}”
role_recipients_irc[sysadmin]=”${DEFAULT_RECIPIENT_IRC}”
role_recipients_syslog[sysadmin]=”${DEFAULT_RECIPIENT_SYSLOG}”
role_recipients_prowl[sysadmin]=”${DEFAULT_RECIPIENT_PROWL}”
role_recipients_awssns[sysadmin]=”${DEFAULT_RECIPIENT_AWSSNS}”
role_recipients_custom[sysadmin]=”${DEFAULT_RECIPIENT_CUSTOM}”
role_recipients_msteams[sysadmin]=”${DEFAULT_RECIPIENT_MSTEAMS}”
role_recipients_rocketchat[sysadmin]=”${DEFAULT_RECIPIENT_ROCKETCHAT}”
role_recipients_dynatrace[sysadmin]=”${DEFAULT_RECIPIENT_DYNATRACE}”
role_recipients_opsgenie[sysadmin]=”${DEFAULT_RECIPIENT_OPSGENIE}”
role_recipients_matrix[sysadmin]=”${DEFAULT_RECIPIENT_MATRIX}”
role_recipients_stackpulse[sysadmin]=”${DEFAULT_RECIPIENT_STACKPULSE}”
Testing Notifications
To use email notifications, you need sendmail or an equivalent installed on your system. Linux systems use Sendmail or similar programs to, unsurprisingly, send emails to any inbox. You can run the following command by hand, to test alarms configuration:
Edit the health_alarm_notify.conf file, which resides in your /etc/netdata directory.
Testing notification
./edit-config health_alarm_notify.conf
Look for the following lines:
# if a role recipient is not configured, an email will be send to:
DEFAULT_RECIPIENT_EMAIL=”root”
# to receive only critical alarms, set it to “root|critical”
Change the value of DEFAULT_RECIPIENT_EMAIL to the email address at which you’d like to receive notifications.
# if a role recipient is not configured, an email will be sent to:
DEFAULT_RECIPIENT_EMAIL=”[email protected]”
# to receive only critical alarms, set it to “root|critical”
Test email notifications system by first becoming the Netdata user and then asking Netdata to send a test alarm:
# become user netdata
su -s /bin/bash netdata# send test alarms to sysadmin
/usr/libexec/netdata/plugins.d/alarm-notify.sh test
You should see output similar to this:
# SENDING TEST WARNING ALARM TO ROLE: sysadmin
2021-05-10 18:23:38: alarm-notify.sh: INFO: sent email notification for: hostname test.chart.test_alarm is WARNING to ‘[email protected]’
# OK# SENDING TEST CRITICAL ALARM TO ROLE: sysadmin
2021-05-10 18:23:38: alarm-notify.sh: INFO: sent email notification for: hostname test.chart.test_alarm is CRITICAL to ‘[email protected]’
# OK# SENDING TEST CLEAR ALARM TO ROLE: sysadmin
2021-05-10 18:23:39: alarm-notify.sh: INFO: sent email notification for: hostname test.chart.test_alarm is CLEAR to ‘[email protected]’
# OK
… and you should get three separate emails, one for each test alarm, in your inbox! (Be sure to check your spam folder.)
3.Configuring Health monitoring alarms
Netdata comes with hundreds of pre-configured alarms that don’t require configuration and also the alarm and notification system are incredibly adaptable to your infrastructure’s unique needs.
Tune Netdata’s pre-configured alarms:
The first chart you see on any Netdata dashboard is the system.cpu chart, which shows the system’s CPU utilization across all cores. To figure out which file you need to edit to tune this alarm, click the Alarms button at the top of the dashboard, click on the All tab, and find the system – CPU alarm entity.
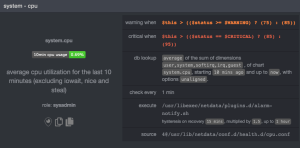
Look at the source row in the table. This means the system.cpu chart sources its health alarms from 4@/usr/lib/netdata/conf.d/health.d/cpu.conf. To tune these alarms, you’ll need to edit the alarm file at health.d/cpu.conf. Go to your Netdata config directory and use the edit-config script.
./edit-config health.d/cpu.conf
The first health entity in that file looks like this:
[root@vmi553071 health.d]# cat cpu.conf
# you can disable an alarm notification by setting the ‘to’ line to: silent
template: 10min_cpu_usage
on: system.cpu
class: System
component: CPU
type: Utilization
os: linux
hosts: *
lookup: average -10m unaligned of user,system,softirq,irq,guest
units: %
every: 1m
warn: $this > (($status >= $WARNING) ? (75) : (85))
crit: $this > (($status == $CRITICAL) ? (85) : (95))
delay: down 15m multiplier 1.5 max 1h
info: average CPU utilization over the last 10 minutes (excluding iowait, nice and steal)
to: sysadmin
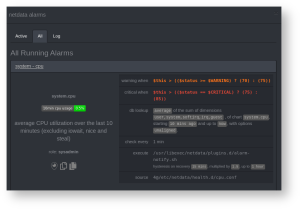
Let’s say you want to tune this alarm to trigger warning and critical alarms at a lower CPU utilization. You can change the warn and crit lines to the values of your choosing. For example:
warn: $this > (($status >= $WARNING) ? (70) : (75))
crit: $this > (($status == $CRITICAL) ? (75) : (85))
You can restart Netdata with systemctl restart netdata, to enable your tune, but you can also reload only the health monitoring component using the command netdatacli reload-health. You can see the change of the configuration file under source to 4@/etc/netdata/health.d/cpu.conf and the changed threshold values at the warn and crit lines below.
You can tune all other pre-configured services following this method.
Silence an individual alarm
Instead of disabling any given alarm, or even all alarms, you can silence individual alarms by changing one line in a given health entity. Let’s look at that health/cpu.conf file again.
template: 10min_cpu_usage
on: system.cpu
class: System
component: CPU
type: Utilization
os: linux
hosts: *
lookup: average -10m unaligned of user,system,softirq,irq,guest
units: %
every: 1m
warn: $this > (($status >= $WARNING) ? (75) : (85))
crit: $this > (($status == $CRITICAL) ? (85) : (95))
delay: down 15m multiplier 1.5 max 1h
info: average CPU utilization over the last 10 minutes (excluding iowait, nice and steal)
to: sysadmin
To silence this alarm, change sysadmin to silent. Use netdatacli reload-health to reload your health configuration. You can add to: silent to any alarm you’d rather not bother you with notifications.