


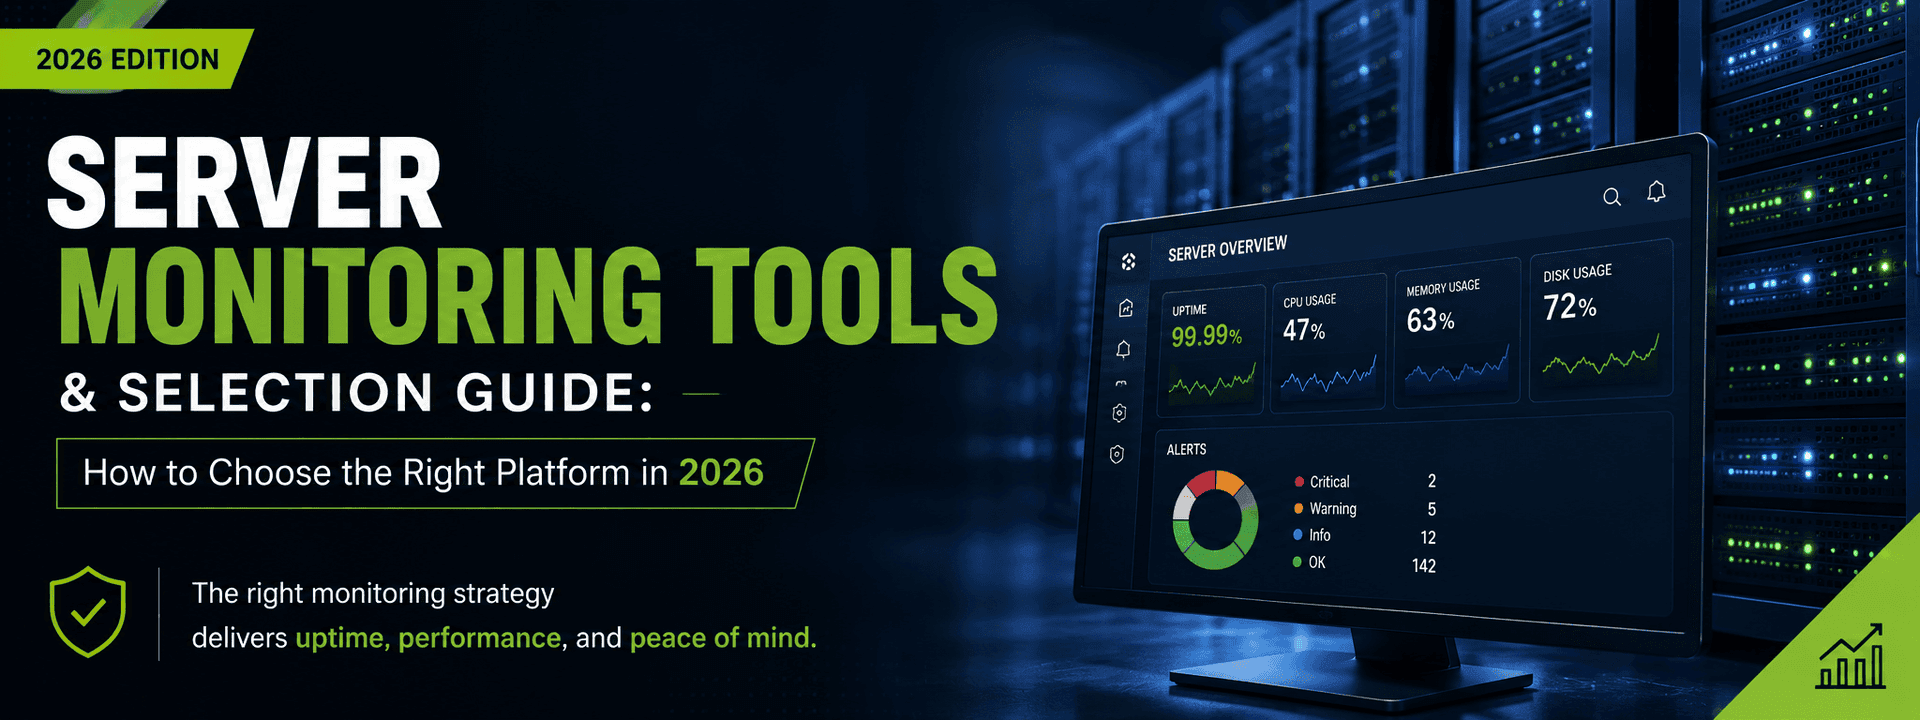
A server that goes down silently is far more dangerous than one that goes down loudly. The right monitoring tool is what stands between the two - but the tool is only half the answer.
Introduction
Every hosting provider, MSP, and IT team eventually asks the same question: "Which server monitoring tool should we use?" It sounds like a simple procurement decision. It isn't. The market offers dozens of server monitoring and observability platforms in 2026, ranging from free, self-hosted tools such as Prometheus and Zabbix to commercial observability platforms such as Datadog and Dynatrace.
This guide breaks down what server monitoring tools need to do, the criteria that should drive your decision, how the leading platforms compare, and - critically - why the tool itself is never the full solution to uptime.
What Is Server Monitoring, and Why Is It Non-Negotiable?
Server monitoring is the continuous tracking of infrastructure health - CPU, memory, disk, network, processes, and services - so that problems are caught before they become customer-facing outages. For hosting companies and anyone running production infrastructure, it's the earliest possible warning system for the two things that damage a business fastest: downtime and slow, silent performance degradation.
Without it, the first sign of trouble is usually a support ticket from an angry customer. With it, an engineer is already investigating before anyone outside your team notices.
Key Metrics Every Server Monitoring Tool Should Track
Regardless of which platform you choose, it needs to give you reliable visibility into:
- CPU utilization and load average - sustained spikes signal resource contention or runaway processes.
- Memory usage and swap activity - early indicator of memory leaks or undersized instances.
- Disk I/O and disk space - sustained I/O contention or critically low disk space can cause severe performance degradation, application failures, and in some cases service outages.
- Network throughput and latency - bandwidth saturation, packet loss, and connection errors.
- Process and service status - is MySQL, Apache, Nginx, or your application actually running?
- Uptime and response time - from both inside the server and externally, simulating a real visitor.
- Log data - correlating error logs with metric spikes cuts investigation time dramatically.
A tool that only covers two or three of these gives you a partial picture - and partial pictures are how outages get missed.
Types of Server Monitoring Tools You'll Encounter
Agent-Based vs. Agentless
Agent-based monitoring is often preferred when teams need deep visibility into processes, services, and host-level metrics, while agentless approaches can be useful where installing software is impractical or restricted.
Open Source vs. Commercial
Open-source stacks (Zabbix, Prometheus + Grafana, Nagios) are genuinely free to run but shift the cost into engineering time - configuration, maintenance, and scaling the collection layer yourself. Commercial platforms (Site24x7, Datadog, SolarWinds, ManageEngine OpManager) trade a subscription fee for faster deployment, polished dashboards, and vendor-managed scaling.
On-Prem, Cloud, and Hybrid Coverage
If your infrastructure spans dedicated servers, VPS, and cloud instances across AWS, GCP, or Azure, confirm the tool can monitor all of it from a single pane - not three disconnected dashboards.
8 Selection Criteria to Evaluate Before You Buy
- Metric coverage and architecture - Does it support agent-based, agentless, SNMP, and cloud-native metrics? Does it reach VMware, Docker, and Kubernetes as well as bare-metal servers?
- Alerting and noise control - Static thresholds generate false alarms; look for dynamic baselines and anomaly detection that separate real incidents from normal fluctuation.
- Scalability - Can it grow from ten servers to a thousand without re-architecting your monitoring stack?
- Integrations - Does it plug into your incident management (PagerDuty, OpsGenie), communication tools (Slack, Teams), and automation frameworks (Terraform, Ansible)?
- Security and access control - LDAP/Active Directory/OIDC support and role-based access matter once more than one team touches the dashboard.
- Pricing transparency - Per-host, per-metric, or usage-based ingestion pricing can swing your total cost dramatically as you scale. Get the real numbers before committing, not just the entry-tier price.
- Dashboard usability - A tool your team won't daily provides zero value, regardless of its feature list.
- Historical data and reporting - Trend data is what lets you catch capacity problems weeks before they become incidents, not just react to the incident itself.
The license price is only one part of the monitoring cost. Before choosing a platform, calculate the total cost of ownership, including implementation, agent deployment, configuration, integrations, dashboard development, alert tuning, storage and retention, maintenance, and the engineering time required to operate the platform.

Top Server Monitoring Tools Compared (2026)
There is no universal "best" tool - only the best fit for your infrastructure, team size, and operational maturity.
Tool | Best For | Deployment | Pricing Model | Standout Feature |
Zabbix | Teams with in-house ops capacity wanting a free, full-featured platform | Self-hosted | Open source; no license fee | Highly customizable, no licensing cost at any scale |
Prometheus + Grafana | Cloud-native / Kubernetes environments | Self-hosted | Free (open source) | Widely adopted for cloud-native and Kubernetes monitoring |
Nagios | Legacy environments already standardized on it | Self-hosted | Free / paid add-ons | Open-source core; commercial editions available |
PRTG Network Monitor | Server and network infrastructure monitoring | On-prem / cloud | Per-sensor licensing | Strong network + server visibility in one tool |
ManageEngine OpManager | Mid-market IT teams wanting an affordable all-in-one | On-prem / cloud | Per-device tiers | Broad IT infrastructure coverage at moderate cost |
Site24x7 | Hosting companies wanting servers + uptime + APM in one console | Cloud (SaaS) | Per-monitor / tiered plans | AI-based anomaly detection, VMware & Kubernetes support |
Datadog | Enterprises needing full observability across apps and infra | Cloud (SaaS) | Usage-based | Deep APM + infrastructure correlation |
SolarWinds | Enterprises managing complex hybrid and multi-cloud environments | Self-hosted / SaaS | Node-based for self-hosted; SaaS modules use different usage metrics | Broad infrastructure and hybrid-cloud observability |
Which Tool Fits Your Hosting Business?
- Startups and small resellers with a handful of servers may benefit from a managed commercial platform for faster deployment, while teams with strong engineering capacity may prefer an open-source stack such as Prometheus and Grafana.
- Growing hosting providers running dozens to hundreds of servers across cPanel/WHM, Plesk, and cloud instances typically need broader metric coverage, stronger alerting logic, and multi-environment support - this is where Zabbix, PRTG, or Site24x7's mid-tier plans earn their keep.
- Enterprise and multi-cloud operators need deep observability, custom integrations, and dedicated support contracts - the territory of Datadog, SolarWinds, or ManageEngine OpManager at scale.
The Real Challenge: A Monitoring Tool Alone Won't Prevent Downtime
This is the part most buying guides skip. A monitoring platform tells you that something is wrong. It does not fix it. Every tool on the list above is only as effective as the team behind it:
- Someone must tune thresholds so alerts are meaningful, not constant noise.
- Someone has to be awake at 3 AM when the alert fires.
- Someone must know cPanel, WHM, Nginx, LiteSpeed, and AWS well enough to diagnose and resolve the issue - not just acknowledge the alert.
- Someone has to document root cause so the same failure doesn't happen again next month.
Buying the best monitoring platform on the market does little to reduce downtime if alerts are left unattended overnight, thresholds are poorly tuned, or the responding team lacks the expertise to diagnose and resolve the underlying issue.
How SupportSages Turns Monitoring into Uptime
- At SupportSages, server monitoring is more than a dashboard that reports when something goes wrong. Our Reactive and Proactive Server Monitoring services combine scheduled infrastructure checks with technical response, helping hosting providers and businesses identify issues early and act before they become customer-facing outages.
- Reactive Server Monitoring: We monitor critical services and resources including network connectivity, SMTP, POP, IMAP, HTTP, FTP, DNS, MySQL/MSSQL, CPU, memory, and disk space. Monitoring checks run at defined intervals so service failures can be identified and addressed quickly.
- Proactive Server Monitoring: Proactive monitoring goes beyond basic service availability. It checks disk usage, mail queues, RAID health, server security, running processes, network traffic, vulnerabilities, logged-in users, control panels, and database services to identify potential problems before they develop into major incidents.
- 24/7 Technical Response: When a monitored issue requires intervention, our L1, L2, and L3 engineers can investigate, troubleshoot, and escalate the incident according to its severity and the agreed support scope.
- Hosting-Focused Expertise: Our engineers work with common hosting and infrastructure environments including cPanel/WHM, Plesk, CloudLinux, Nginx, LiteSpeed, and cloud platforms such as AWS, GCP, and Azure.
- Monitoring Plus Technical Action: Monitoring only creates value when someone can act on the information it provides. Our engineers can investigate alerts, perform troubleshooting, and work toward resolving the underlying issue rather than simply acknowledging an alert.
- White-Label Support: For hosting providers and resellers, SupportSages can operate behind the scenes as an extension of your technical team, allowing you to provide monitoring and technical support under your own brand.
SupportSages offers Reactive Server Monitoring and Proactive Server Monitoring as dedicated monitoring services, allowing businesses to choose the level of visibility and proactive oversight that matches their infrastructure and operational requirements.
Get an Exact Quote for Your Setup
Choosing a monitoring platform is only the first step. If you need help evaluating your monitoring requirements, configuring the right checks, or adding technical response to your monitoring strategy, SupportSages can help. Talk to our team about Reactive or Proactive Server Monitoring for your hosting environment