• DevOps
    Case Study

    How we built a resilient multi-account, multi-cloud solution for a Health Tech service provider!

    READ CASESTUDY
    icon

    24/7 DevOps as a Service

    Round-the-clock DevOps for uninterrupted efficiency.

    icon

    Infrastructure as a Code

    Crafting infrastructure with ingenious code.

    icon

    CI/CD Pipeline

    Automated CI/CD pipeline for seamless deployments.

    icon

    DevSecOps

    Integrated security in continuous DevOps practices.

    icon

    Hire DevOps Engineers

    Level up your team with DevOps visionaries.

    icon

    Consulting Services

    Navigate success with expert DevOps consulting.

  • TechOps
    Case Study

    How we built a scalable Odoo solution for a Travel Tech service provider!

    READ CASESTUDY

    WEB HOSTING SUPPORT

    icon

    HelpDesk Support

    Highly skilled 24/7 HelpDesk Support

    icon

    Product Support

    Boost your product support with our expertise.

    MANAGED SERVICES

    icon

    Server Management

    Don’t let server issues slow you down. Let us manage them for you.

    icon

    Server Monitoring

    Safeguard your server health with our comprehensive monitoring solutions.

    STAFF AUGMENTATION

    icon

    Hire an Admin

    Transform your business operations with our expert administrative support.

    icon

    Hire a Team

    Augment your workforce with highly skilled professionals from our diverse talent pool.

  • CloudOps
    Case Study

    How we helped a Private Deemed University in India, save US $3500/m on hosting charges!

    READ CASESTUDY
    icon

    AWS Well Architected Review

    Round-the-clock for uninterrupted efficiency

    icon

    Optimize

    Efficient CloudOps mastery for seamless cloud management

    icon

    Manage

    Automated CI/CD pipeline for seamless deployments

    icon

    Migrate

    Upgrade the journey, Migrate & Modernize seamlessly

    icon

    Modernize

    Simplify compliance complexities with our dedicated services

    icon

    FinOps as a Service

    FinOps as a Service

  • SecOps
    Case Study

    How we built a scalable Odoo solution for TravelTech service provider!

    READ CASESTUDY
    icon

    VAPT

    Vulnerability Assessment and Penetration Testing

    icon

    Source Code Review

    Ensuring source code security ans safe practices to reduce risks

    icon

    Security Consultation

    On demand services for improving server security

    icon

    System Hardening

    Reduced vulnerability and proactive protection

    icon

    Managed SoC

    Monitors and maintains system security. Quick response on incidents.

    icon

    Compliance as a Service

    Regulatory compliance, reduced risk

  • Insights
    Case Study

    How we helped a Private Deemed University in India, save US $3,500/m on hosting charges!

    READ CASESTUDY
    icon

    Blog

    Explore our latest articles and insights

    icon

    Case Studies

    Read about our client success stories

    icon

    Flipbook

    Explore our latest Flipbook

    icon

    Events

    Join us at upcoming events and conferences

    icon

    Webinars

    Watch our educational webinar series

  • Our Story
  • Contact Us

Interested to collaborate?

Get in touch with us!

Ready to elevate your business with certified cloud expertise? Contact us today to learn how our team can help you leverage cloud technology to drive growth, streamline operations, and enhance security.

  • AWSAWS
  • Azure CloudAzure Cloud
  • Google CloudGoogle Cloud
  • Akamai CloudAkamai Cloud
  • OVHOVH
  • Digital OceanDigital Ocean
  • HetznerHetzner
  • Kubernetes Consultancy Services
  • K8s & Cloud native Solutions
  • 24/7 Infrastructure Monitoring
  • DevOps as a Service
  • Cloud CI/CD Solutions
  • White Labeled MSP Support
  • Our story
  • Life@SupportSages
  • Insights
  • Careers
  • Events
  • Contact Us

Connect with us!


LinkedInFacebookXInstagramYouTube

aws partneraws advanced partner
SupportSages

Copyright © 2008 – 2026 SupportSages Pvt Ltd. All Rights Reserved.
Privacy PolicyLegal TermsData ProtectionCookie Policy

Understanding the netstat command

Travis Ville

  • 6 min read
Understanding the netstat command

Generating audio, please wait...

Netstat is a command-line network utility useful for network troubleshooting and performance measurement. netstat (network statistics) is available in most versions of Windows, Linux, UNIX, and other operating systems. The command provides various network related information such as current TCP/IP connections, routing tables, interface statistics, etc. It is the basic tool which helps us to find the ports that are open and to find programs that are listening on ports.

The output of the netstat command is described below :

  • Proto : The protocol (tcp, udp, raw) used by the socket.

  • Recv-Q : The count of bytes not copied by the user program connected to this socket.

  • Send-Q : The count of bytes not acknowledged by the remote host.

  • Local Address : The address and port number of the local end of the socket.

  • Foreign Address : The address and port number of the remote end of the socket.

  • State : The state of the socket.

    • ESTABLISHED : The socket has an established connection.

    • SYN_SENT : The socket is actively attempting to establish a connection.

    • SYN_RECV : A connection request has been received from the network.

    • FIN_WAIT1 : The socket is closed, and the connection is shutting down.

    • FIN_WAIT2 : Connection is closed, and the socket is waiting for a shutdown from the remote end.

    • TIME_WAIT : The socket is waiting after close to handle packets still in the network.

    • CLOSE : The socket is not being used.

    • CLOSE_WAIT : The remote end has shut down, waiting for the socket to close.

    • LAST_ACK : The remote end has shut down, and the socket is closed. Waiting for acknowledgment.

    • LISTEN : The socket is listening for incoming connections.

    • CLOSING : Both sockets are shut down but we still don’t have all our data sent.

    • UNKNOWN : The state of the socket is unknown.

Netstat Command Practical Examples :

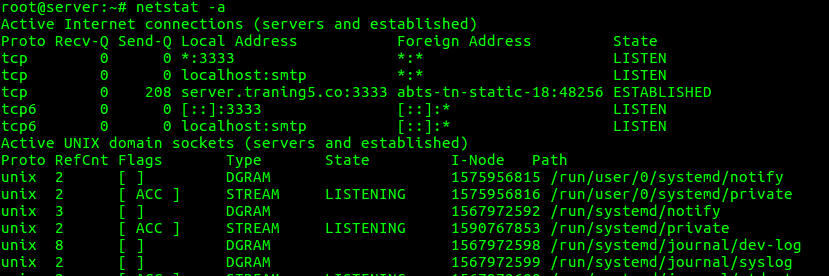
1. To list all the LISTENING Ports of TCP and UDP connections

“netstat -a” option can be used to list all TCP and UDP ports.

root@server:~# netstat -a


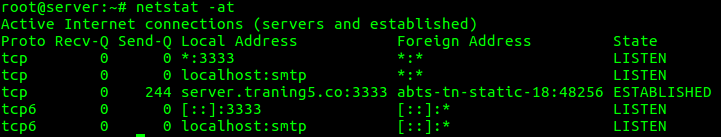
2. To list all the TCP Ports connections

“netstat -at” option can be used to list only TCP (Transmission Control Protocol) port connections.

root@server:~# netstat -at


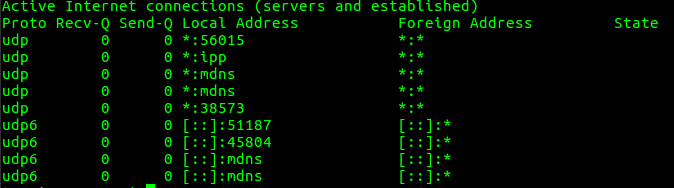
3. To list all the UDP Ports connections

“netstat -au” option can be used to list only UDP (User Datagram Protocol) port connections.

root@server:~# netstat -au

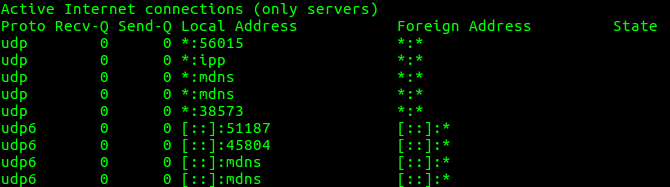
4. To list all listening port connections

“netstat -l” option can be used to list all active listening ports connections.

root@server:~# netstat -l

5. To list all TCP listening Ports

“netstat -lt” option can be used to list all TCP Listening Ports connections.

root@server:~# netstat -lt

6. To list all UDP listening Ports

“netstat -lu” can be used to list all the UDP listening Ports connections.

root@server:~# netstat -lu

7. To list all UNIX Listening Ports

“netstat -lx” option can be used to list all UNIX Listening Ports connections.

root@server:~# netstat -lx

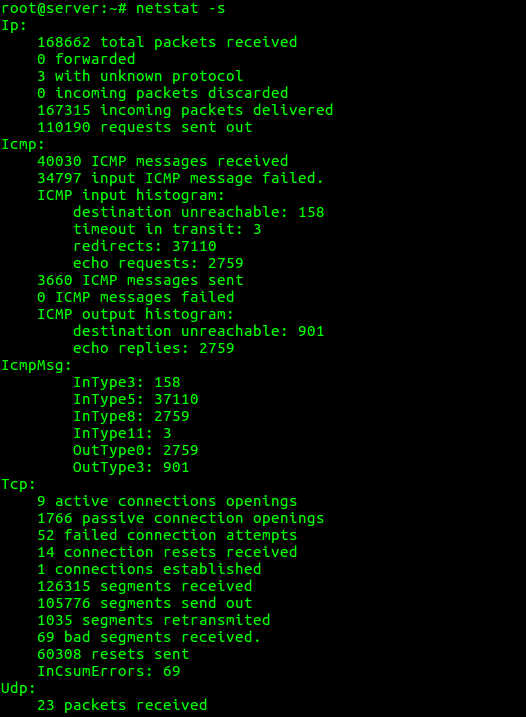
8. To list the statistics for all ports

“netstat -s” option can be used to list the statistics for all ports.

root@server:~# netstat -s

9. To list the statistics for TCP (or) UDP ports

“netstat -st” option can be used to list the statistics for TCP ports.

root@server:~# netstat -st

“netstat -su” option can be used to list the statistics for UDP ports.

root@server:~# netstat -su

10. To display service name with PID

“netstat -tp” option can be used to display the service name with their PID number.

root@server:~# netstat -tp

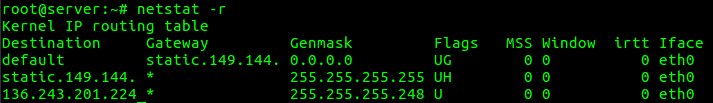
11. To display the kernel routing information

“netstat -r” option can be used to display the kernel routing information.

root@server:~# netstat -r

12. To find listening ports

“netstat -ap” option can be used to find the port on which a program is running.

root@server:~# netstat -ap | grep ssh

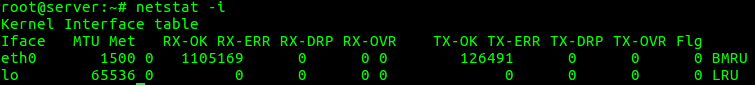
13. To list of network interfaces

“netstat -i” option can be used to list the network interfaces.

root@server:~# netstat -i

“netstat -ie” option can be used to display extended information on the interfaces.

root@server:~# netstat -ie

14. To show which process is using a particular port

netstat -anlp | grep $portnumber

An example of the same is given below.

root@server:~# netstat -anlp | grep 80

When dealing with the traffic on the server, it’s important to be informed about the inbound and outbound connections and port to which they are connected. Netstat command is well suited for this purpose. For more options and information about netstat command, you can use “man netstat” command or refer netstat manual docs.

security audit

  • Security

Continue Your Journey With…

SupportSages

SupportSages

SupportSages provides outsourced web hosting support, DevOps support and AWS. Get 24/7 expert support for seamless performance & security.

Understanding the netstat command

6 ways how Outsourcing Server Management will improve Customer Retention

6 ways how Outsourcing Server Management will improve Customer Retention
  • Sever management
logo

Configuring Firewall with UFW

Configuring Firewall with UFW
  • Firewalls
  • Security
logo

How To Configure Django With Apache In CentOS 7

How To Configure Django With Apache In CentOS 7
  • Apache
logo

Posts by Travis Ville

Travis Ville