
In an era of increasing cyber threats and data breaches, businesses and organizations must be vigilant in protecting their digital assets. Wazuh, an open-source security monitoring platform, plays a crucial role in this endeavor. This short note provides an overview of Wazuh, highlighting its key features and benefits for cybersecurity.
What is Wazuh?
Wazuh is an open-source security information and event management (SIEM) tool designed to enhance threat detection, intrusion detection, vulnerability detection, and response capabilities. It was developed to provide organizations with a cost-effective and efficient way to monitor and analyze security events in real-time.
This Blog guides through an installation of the Wazuh server and Elastic Stack components in an all-in-one configuration for CentOS servers.
Note: You need root user privileges to run all the commands described below.
Installing prerequisites
Some extra packages are needed for the installation, such as curl or unzip, which will be used in further steps. However, this step can be skipped if curl and unzip are already installed on the server.
yum install zip unzip curlInstalling Elasticsearch
Elasticsearch is a highly scalable full-text search and analytics engine.
Adding the Elastic Stack repository
- Import the GPG key:
rpm --import https://artifacts.elastic.co/GPG-KEY-elasticsearch2. Add the repository:
cat > /etc/yum.repos.d/elastic.repo << EOF
[elasticsearch-7.x]
name=Elasticsearch repository for 7.x packages
baseurl=https://artifacts.elastic.co/packages/7.x/yum
gpgcheck=1
gpgkey=https://artifacts.elastic.co/GPG-KEY-elasticsearch
enabled=1
autorefresh=1
type=rpm-md
EOF
Elasticsearch installation and configuration
- Install the Elasticsearch package
yum install elasticsearch-7.17.132. Download the configuration file /etc/elasticsearch/elasticsearch.yml as follows:
curl -so /etc/elasticsearch/elasticsearch.yml https://packages.wazuh.com/4.5/tpl/elastic-basic/elasticsearch_all_in_one.ymlCertificates creation and deployment
- Download the configuration file for creating the certificates:
curl -so /usr/share/elasticsearch/instances.yml https://packages.wazuh.com/4.5/tpl/elastic-basic/instances_aio.ymlIn the following steps, a file that contains a folder named after the instance defined here will be created. This folder will contain the certificates and the keys necessary to communicate with the Elasticsearch node using SSL.
2. The certificates can be created using the elasticsearch-certutil tool:
/usr/share/elasticsearch/bin/elasticsearch-certutil cert ca --pem --in instances.yml --keep-ca-key --out ~/certs.zip3. Extract the generated /usr/share/elasticsearch/certs.zip file from the previous step.
unzip ~/certs.zip -d ~/certs4. The next step is to create the directory /etc/elasticsearch/certs, and then copy the CA file, the certificate and the key there:
mkdir /etc/elasticsearch/certs/ca -p
cp -R ~/certs/ca/ ~/certs/elasticsearch/* /etc/elasticsearch/certs/
chown -R elasticsearch: /etc/elasticsearch/certs
chmod -R 500 /etc/elasticsearch/certs
chmod 400 /etc/elasticsearch/certs/ca/ca.* /etc/elasticsearch/certs/elasticsearch.*
rm -rf ~/certs/ ~/certs.zip
5. Enable and start the Elasticsearch service:
systemctl daemon-reload
systemctl enable elasticsearch
systemctl start elasticsearch
6. Generate credentials for all the Elastic Stack pre-built roles and users:
/usr/share/elasticsearch/bin/elasticsearch-setup-passwords autoThe command above will prompt an output like this. Save the password of the elastic user for further steps:
Changed password for user apm_system
PASSWORD apm_system = lLPZhZkB6oUOzzCrkLSF

Changed password for user kibana_system
PASSWORD kibana_system = TaLqVOnSoqKTYLIU0vDn

Changed password for user kibana
PASSWORD kibana = TaLqVOvXoqKTYLIU0vDn

Changed password for user logstash_system
PASSWORD logstash_system = UtuDv2tWkXGYL83v9kWA

Changed password for user beats_system
PASSWORD beats_system = qZcbvCslafMpoEOrE9Ob

Changed password for user remote_monitoring_user
PASSWORD remote_monitoring_user = LzJpQiSylncmCU2GLBTS

Changed password for user elastic
PASSWORD elastic = AN4UeQGA7HGl5iHpMla7
To check that the installation was made successfully, run the following command replacing <elastic_password> with the password generated in the previous step for elastic user:
curl -XGET https://localhost:9200 -u elastic:<elastic_password> -kThis command should have an output like this:
{
"name" : "elasticsearch",
"cluster_name" : "elasticsearch",
"cluster_uuid" : "EFEejKSIT7SMp6-f5fDI3A",
"version" : {
"number" : "7.17.13",
"build_flavor" : "default",
"build_type" : "rpm",
"build_hash" : "2b211dbb8bfdecaf7f5b44d356bdfe54b1050c13",
"build_date" : "2023-08-31T17:33:19.958690787Z",
"build_snapshot" : false,
"lucene_version" : "8.11.1",
"minimum_wire_compatibility_version" : "6.8.0",
"minimum_index_compatibility_version" : "6.0.0-beta1"
},
"tagline" : "You Know, for Search"
}
Installing Wazuh server

Adding the Wazuh repository
- Import the GPG key:
rpm --import https://packages.wazuh.com/key/GPG-KEY-WAZUH2. Add the repository:
cat > /etc/yum.repos.d/wazuh.repo << EOF
[wazuh]
gpgcheck=1
gpgkey=https://packages.wazuh.com/key/GPG-KEY-WAZUH
enabled=1
name=EL-\$releasever - Wazuh
baseurl=https://packages.wazuh.com/4.x/yum/
protect=1
EOF
Installing the Wazuh manager
1. Install the Wazuh manager package:
yum install wazuh-manager2. Enable and start the Wazuh manager service:
systemctl daemon-reload
systemctl enable wazuh-manager
systemctl start wazuh-manager
3. Run the following command to check if the Wazuh manager is active:
systemctl status wazuh-managerInstalling Filebeat
Filebeat is the tool on the Wazuh server that securely forwards alerts and archived events to Elasticsearch.
Filebeat installation and configuration
- Install the Filebeat package:
yum install filebeat-7.17.132. Download the pre-configured Filebeat config file used to forward Wazuh alerts to Elasticsearch:
curl -so /etc/filebeat/filebeat.yml https://packages.wazuh.com/4.5/tpl/elastic-basic/filebeat_all_in_one.yml3. Download the alerts template for Elasticsearch:
curl -so /etc/filebeat/wazuh-template.json https://raw.githubusercontent.com/wazuh/wazuh/4.5/extensions/elasticsearch/7.x/wazuh-template.json
chmod go+r /etc/filebeat/wazuh-template.json
4. Download the Wazuh module for Filebeat:
curl -s https://packages.wazuh.com/4.x/filebeat/wazuh-filebeat-0.2.tar.gz | tar -xvz -C /usr/share/filebeat/module5. Edit the file /etc/filebeat/filebeat.yml and add the following line:
output.elasticsearch.password: <elasticsearch_password>Replace elasticsearch_password with the previously generated password for elastic user.
6. Copy the certificates into /etc/filebeat/certs/
cp -r /etc/elasticsearch/certs/ca/ /etc/filebeat/certs/
cp /etc/elasticsearch/certs/elasticsearch.crt /etc/filebeat/certs/filebeat.crt
cp /etc/elasticsearch/certs/elasticsearch.key /etc/filebeat/certs/filebeat.key
7. Enable and start the Filebeat service:
systemctl daemon-reload
systemctl enable filebeat
systemctl start filebeat
To ensure that Filebeat has been successfully installed, run the following command:
filebeat test outputThis command should have an output like this:
elasticsearch: https://127.0.0.1:9200...
parse url... OK
connection...
parse host... OK
dns lookup... OK
addresses: 127.0.0.1
dial up... OK
TLS...
security: server's certificate chain verification is enabled
handshake... OK
TLS version: TLSv1.3
dial up... OK
talk to server... OK
version: 7.17.13
Kibana installation and configuration
Kibana is a flexible and intuitive web interface for mining and visualizing the events and archives stored in Elasticsearch.
- Install the Kibana package:
yum install kibana-7.17.132. Copy the Elasticsearch certificates into the Kibana configuration folder:
mkdir /etc/kibana/certs/ca -p
cp -R /etc/elasticsearch/certs/ca/ /etc/kibana/certs/
cp /etc/elasticsearch/certs/elasticsearch.key /etc/kibana/certs/kibana.key
cp /etc/elasticsearch/certs/elasticsearch.crt /etc/kibana/certs/kibana.crt
chown -R kibana:kibana /etc/kibana/
chmod -R 500 /etc/kibana/certs
chmod 440 /etc/kibana/certs/ca/ca.* /etc/kibana/certs/kibana.*
3. Download the Kibana configuration file:
curl -so /etc/kibana/kibana.yml https://packages.wazuh.com/4.5/tpl/elastic-basic/kibana_all_in_one.ymlEdit the /etc/kibana/kibana.yml file:
elasticsearch.password: <elasticsearch_password>Values to be replaced:
<elasticsearch_password>: the password generated during the Elasticsearch installation and configuration for theelasticuser.
4. Create the /usr/share/kibana/data directory:
mkdir /usr/share/kibana/data
chown -R kibana:kibana /usr/share/kibana
5. Install the Wazuh Kibana plugin. The installation of the plugin must be done from the Kibana home directory as follows:
cd /usr/share/kibana
sudo -u kibana /usr/share/kibana/bin/kibana-plugin install https://packages.wazuh.com/4.x/ui/kibana/wazuh_kibana-4.5.3_7.17.13-1.zip
6. Link Kibana’s socket to privileged port 443:
setcap 'cap_net_bind_service=+ep' /usr/share/kibana/node/bin/node7. Enable and start the Kibana service:
systemctl daemon-reload
systemctl enable kibana
systemctl start kibana
8. Access the web interface using the password generated during the Elasticsearch installation process:
URL: https://<wazuh_server_ip>
user: elastic
password: <PASSWORD_elastic>
How to add Wazuh agents to monitor the server
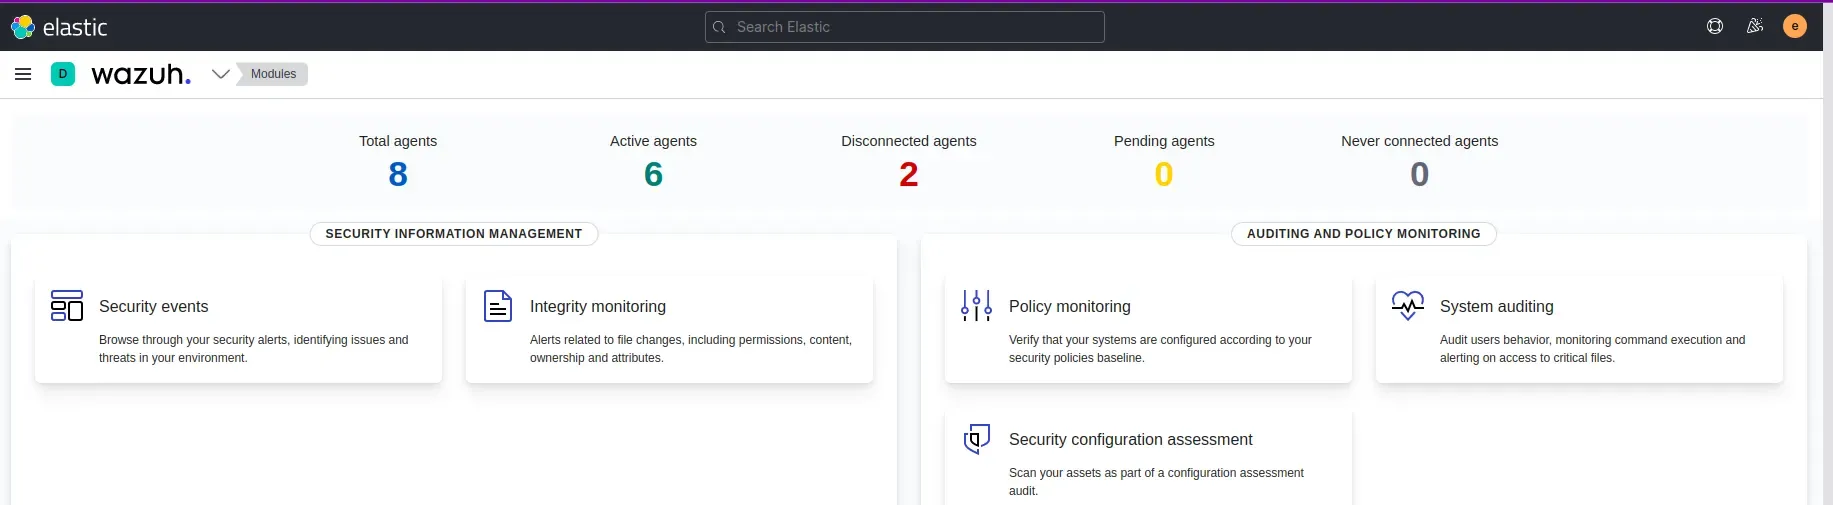
After you have logged in to the Wazuh Server, you will get a screen similar to below:
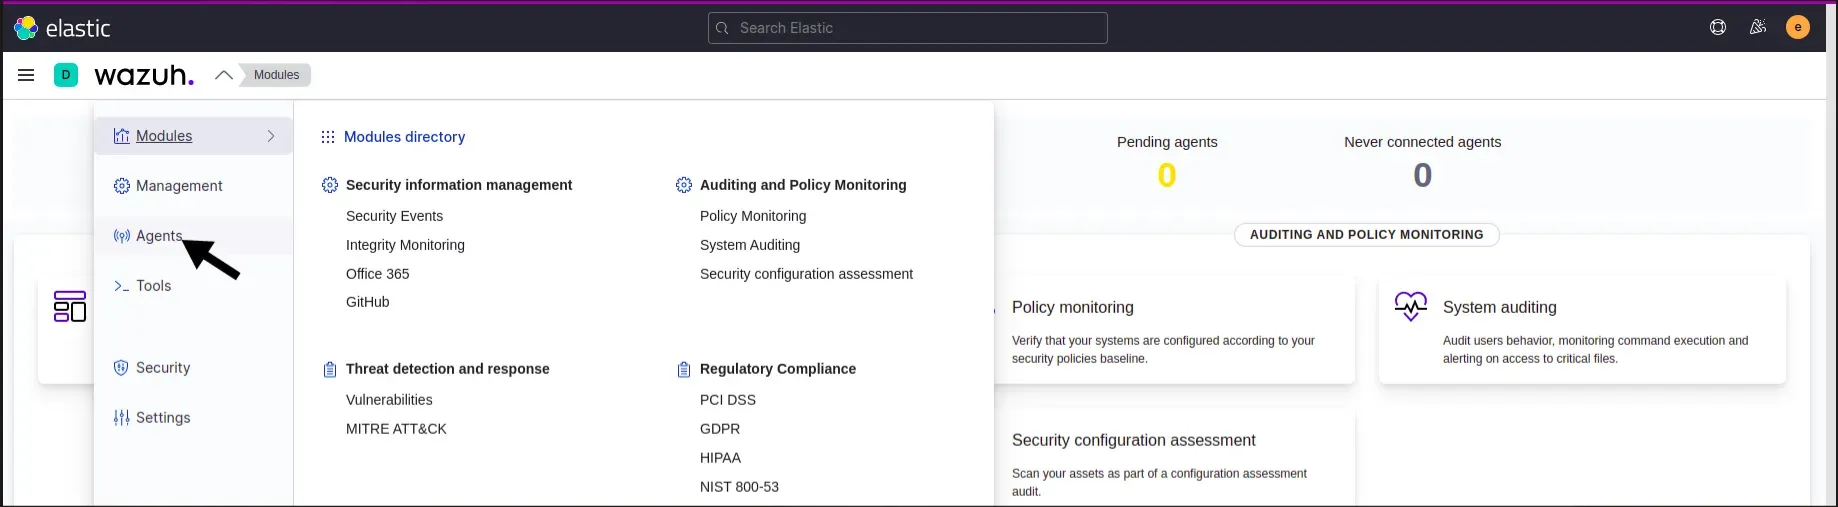
From the homescreen, we need to go to Agents from the top left dropdown
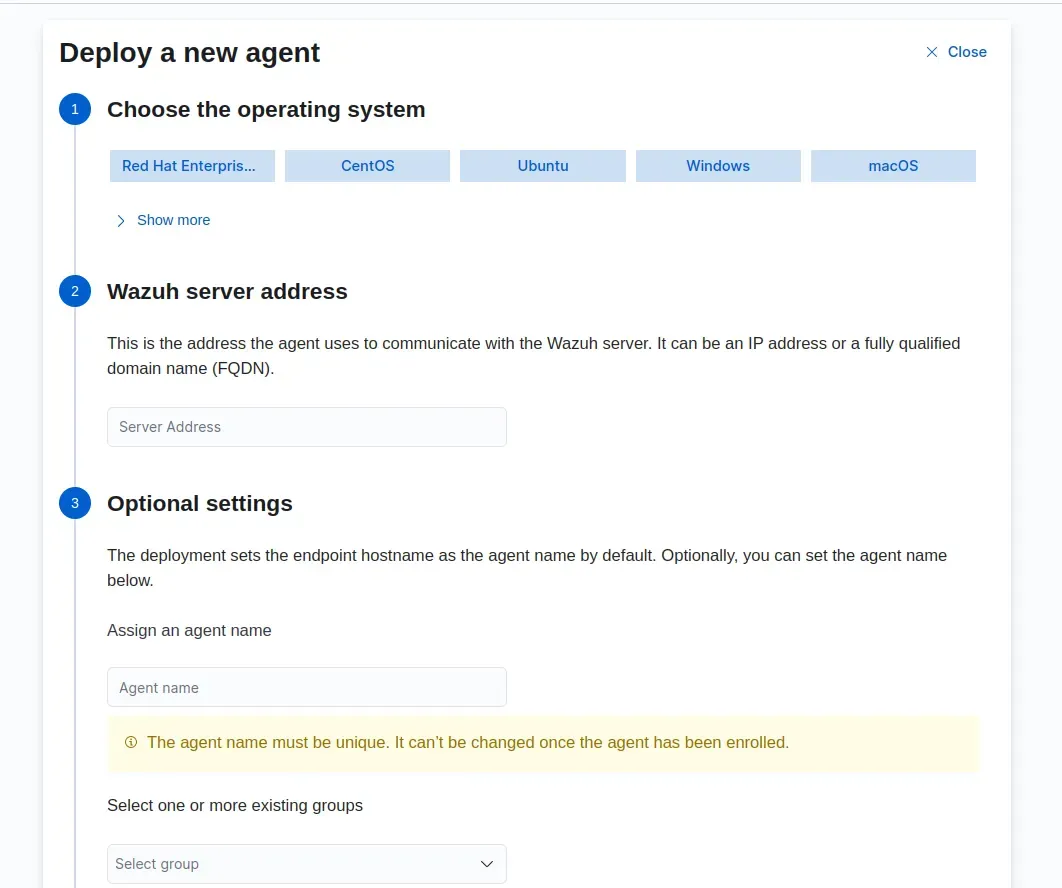
The next step is to install the agent in our server, for that we can get the command from our Wazuh dashboard itself in the agent screen. All we need to do is just enter the configuration of our server’s configuration. You will get a similar screen below.
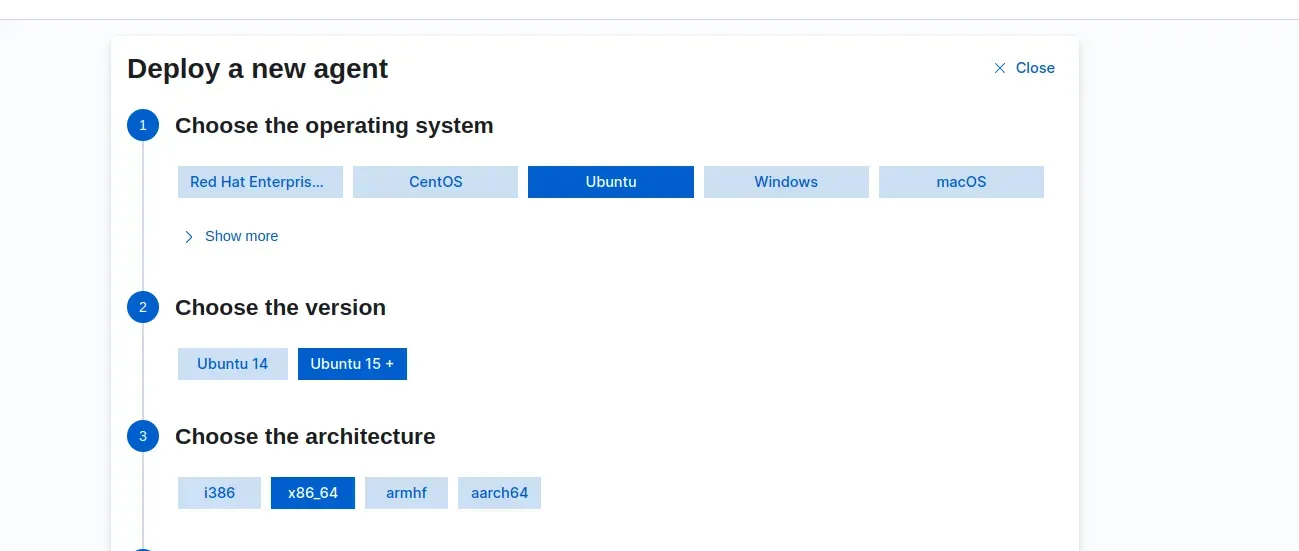
Consider that I want to monitor a ubuntu 20.04 server, we should configure this in the agent screen accordingly.
Then you need to enter some more details like below:
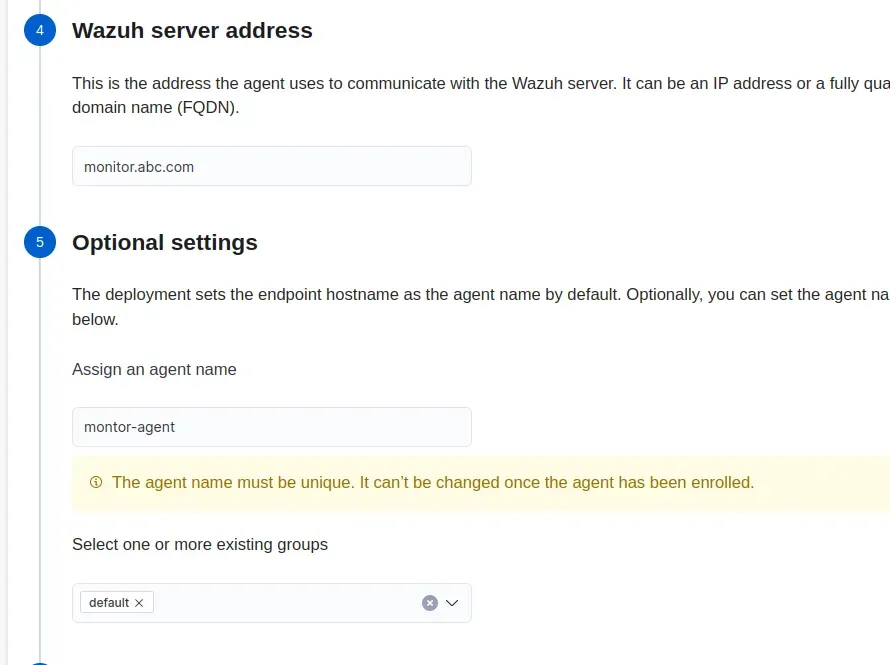
Wazuh Server address: You need to give the domain name/IP where Wazuh is installed and configured.
Agent-name: You can name a unique agent name for your server to be monitored.
For example, suppose you are going to monitor a nginx server, you can name it nginx-agent and so on.
We can create a group in Wazuh, like for frontend applications or backend applications. I will provide the details on how to create groups in Wazuh below.
After you have configured all these, you will get a command from there like below.
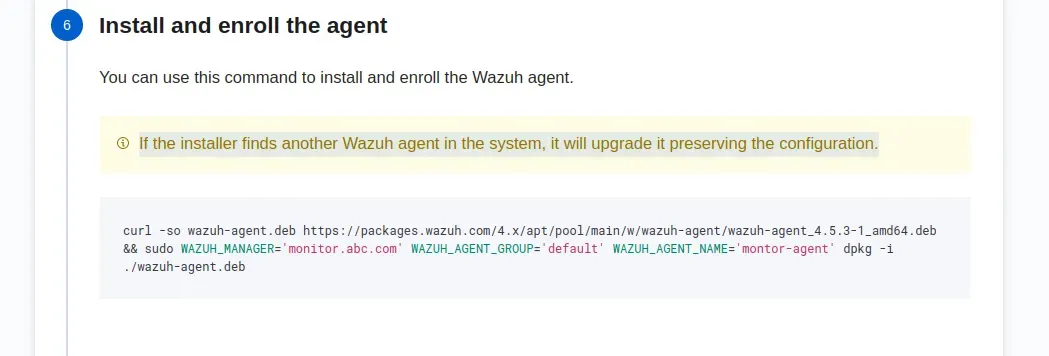
Copy this command and run the command in the server that is going to be monitored.(ubuntu 20.04 server)
After this command is ran, you should run the below commands:
sudo systemctl daemon-reload
sudo systemctl enable wazuh-agent
sudo systemctl start wazuh-agent
Once everything is done, your server will be listed in agents screen like below:
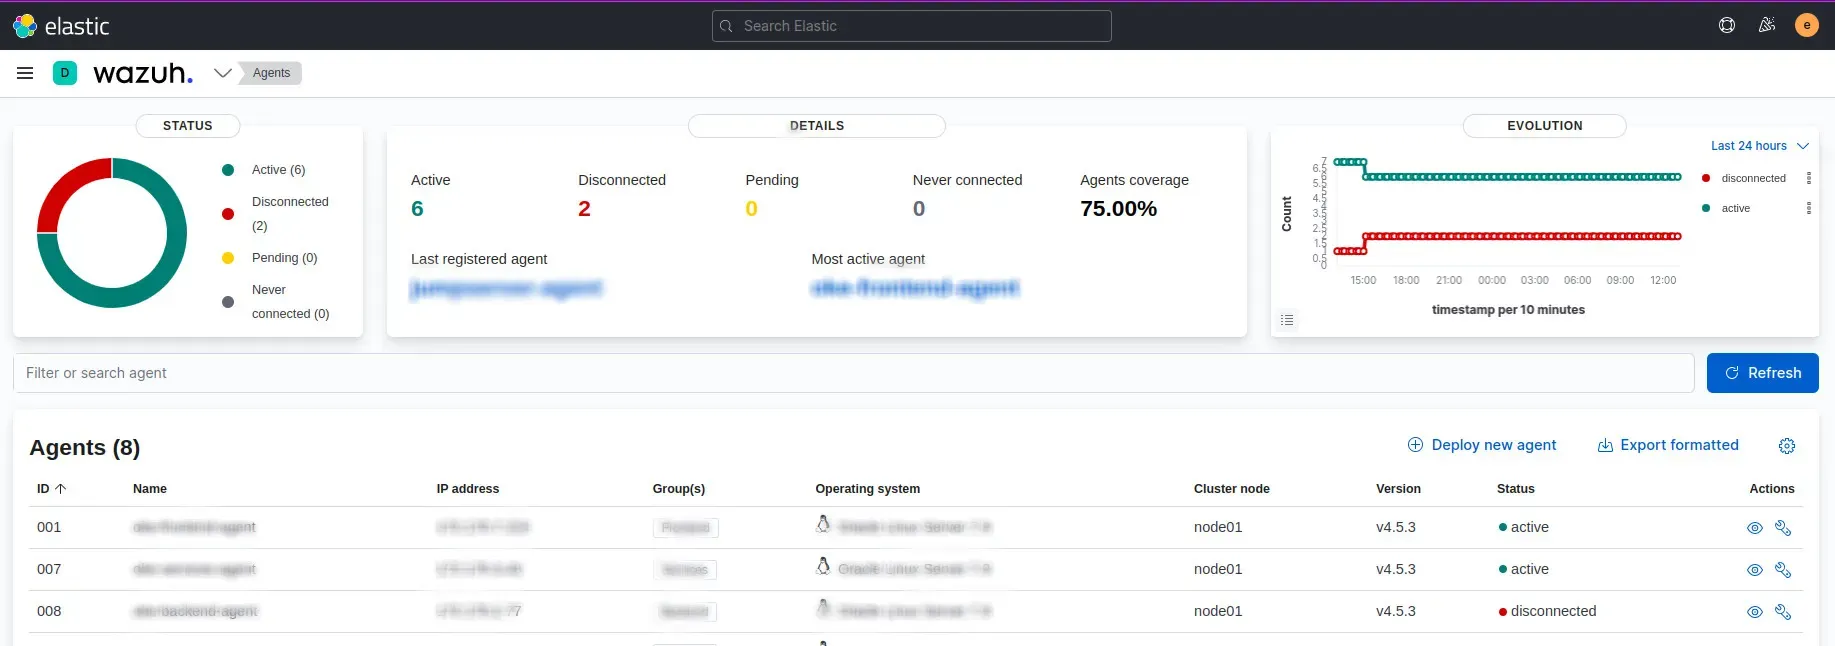
If your server doesn’t show up, it means that there are some errors in the agent configuration. You can troubleshoot it by examining the logs in the location “/var/ossec/logs/ossec.log” and act accordingly.
How to create Groups in Wazuh
Creating Groups in Wazuh is a straight forward method. From the left top dropdwon where we selected “agents” page, there is a page called “management” and we can see a page called group inside this “management page”. Below is a screenshot for your reference

After you enter the groups page, you can create a group with the name as you wish. It’s that simple.
Strengthen your systems with Wazuh, the open-source security tool. Follow our detailed installation guide for comprehensive setup. At SupportSages, discover enhanced cybersecurity insights. Empower your defense mechanisms effectively. Explore Wazuh, a perfect fit for DevOps and robust threat monitoring. Elevate your security today!