Published on: May 21, 2009 by Faheem P.

Scenario:
This post describes about remote Windows server monitoring using Nagios on Linux. These instructions assume that you’ve installed Nagios according to the previous post.
Windows server monitoring requires that you install an agent to monitor private services and attributes of a Windows machine.This agent acts as a proxy between the Nagios plugin that does the monitoring and the actual service or attribute of the Windows machine. Without installing an agent on the Windows box, Nagios would be unable to monitor private services or attributes of the Windows box.
Overview
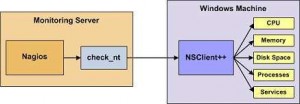
We will be installing the NSClient++ addon on the Windows machine and using the check_nt plugin to communicate with the NSClient++ addon. The check_nt plugin should already be installed on the Nagios server if you followed the previous post.

we will be installing the NSClient++ addon on the Windows machine and using the check_nt plugin to communicate with the NSClient++ addon. The check_nt plugin should already be installed on the Nagios server if you followed the previous post.
There are several steps you’ll need to follow in order to monitor a new Windows machine. They are:
1. Perform first-time prerequisites
2. Install a windows server monitoring agent
3. Create new host and service definitions for monitoring the Windows machine
4. Restart the Nagios daemon
Following three steps will happen on a very high level when Nagios (installed on the nagios-server) monitors a service (for e.g. disk space usage) on the remote Windows host.
1. Nagios will execute check_nt command on nagios-server and request it to monitor disk usage on remote windows host.
2. The check_nt on the nagios-server will contact the NSClient++ service on remote windows host and request it to execute the USEDDISKSPACE on the remote host.
3. The results of the USEDDISKSPACE command will be returned back by NSClient++ daemon to the check_nt on nagios-server.
Following flow summarizes the above explanation:
Nagios Server (check_nt) —–> Remote host (NSClient++) —–> USEDDISKSPACE
Nagios Server (check_nt) <—– Remote host (NSClient++) <—– USEDDISKSPACE (returns disk space usage)
Prerequisites
The first time you configure Nagios to monitor a Windows machine, you’ll need to do a bit of extra work. Remember, you only need to do this for the *first* Windows machine you monitor.
Edit the main Nagios config file.
vi /usr/local/nagios/etc/nagios.cfg
Remove the leading pound (#) sign from the following line in the main configuration file:
#cfg_file=/usr/local/nagios/etc/objects/windows.cfg
Save the file and exit.
Installing the Windows Agent:
Before you can begin monitoring private services and attributes of Windows machines, you’ll need to install an agent on those machines.
1. Download the latest stable version of the NSClient++ addon from
http://sourceforge.net/projects/nscplus
2. Unzip the NSClient++ files into a new C:\NSClient++ directory
3. Open a command prompt and change to the C:\NSClient++ directory
4. Register the NSClient++ system service with the following command:
nsclient++ /install
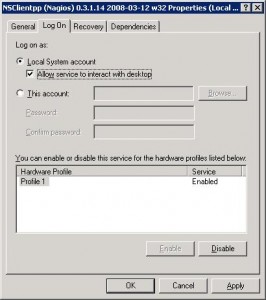
5. Open the services manager and make sure the NSClientpp service is allowed to interact with the desktop (see the ’Log On’ tab of the services manager). If it isn’t already allowed to interact with the desktop, check the box to allow it to.

6. Edit the NSC.INI file (located in the C:\NSClient++ directory) and make the following changes:
Uncomment all the modules listed in the [modules] section, except for CheckWMI.dll and RemoteConfiguration.dll
Optionally require a password for clients by changing the ’password’ option in the [Settings] section.
Uncomment the ’allowed_hosts’ option in the [Settings] section. Add the IP address of the Nagios server to this line, or leave it blank to allow all hosts to connect.
Make sure the ’port’ option in the [NSClient] section is uncommented and set to ’12489’ (the default port).
7. Start the NSClient++ service with the following command:
nsclient++ /start
8. If installed properly, a new icon should appear in your system tray. It will be a yellow circle with a
black ’M’ inside.
9. Success! The next step is adding windows server to the Nagios configuration for windows server monitoring …
Configuring Nagios
Now it’s time to define some object definitions in your Nagios configuration files in order to monitor the new Windows machine.
Open the windows.cfg file for editing.
vi /usr/local/nagios/etc/objects/windows.cfg
Add a new host definition for the Windows machine that you’re going to monitor. If this is the *first* Windows machine you’re monitoring, you can simply modify the sample host definition in windows.cfg. Change the host_name, alias, and address fields to appropriate values for the Windows box.
define host{
use windows-server ; Inherit default values from a Windows server template (make sure you keep this line!)
host_name winserver
alias My Windows Server
address 192.168.1.2
}
Replace “winserver” in the example definitions below with the name you specified in the host_name directive of the host definition you just added.
Now you can add some service definitions (to the same configuration file) in order to tell Nagios to monitor different aspects of the Windows machine. If this is the *first* Windows machine you’re monitoring, you can simply modify the sample service definitions in windows.cfg
Add the following service definition to monitor the version of the NSClient++ addon that is running on the Windows server. This is useful when it comes time to upgrade your Windows servers to a newer version of the addon, as you’ll be able to tell which Windows machines still need to be upgraded to the latest version of NSClient++.
define service{
use generic-service
host_name winserver
service_description NSClient++ Version
check_command check_nt!CLIENTVERSION
}
Add the following service definition to monitor the uptime of the Windows server.
define service{
use generic-service
host_name winserver
service_description Uptime
check_command check_nt!UPTIME
}
Add the following service definition to monitor the CPU utilization on the Windows server and generate a CRITICAL alert if the 5-minute CPU load is 90% or more or a WARNING alert if the 5-minute load is 80% or greater.
define service{
use generic-service
host_name winserver
service_description CPU Load
check_command check_nt!CPULOAD!-l 5,80,90
}
Add the following service definition to monitor memory usage on the Windows server and generate a CRITICAL alert if memory usage is 90% or more or a WARNING alert if memory usage is 80% or greater.
define service{
use generic-service
host_name winserver
service_description Memory Usage
check_command check_nt!MEMUSE!-w 80 -c 90
}
Add the following service definition to monitor usage of the C:\ drive on the Windows server and generate a CRITICAL alert if disk usage is 90% or more or a WARNING alert if disk usage is 80% or greater.
define service{
use generic-service
host_name winserver
service_description C:\ Drive Space
check_command check_nt!USEDDISKSPACE!-l c -w 80 -c 90
}
Password Protection
If you specified a password in the NSClient++ configuration file on the Windows machine, you’ll need to modify the check_nt command definition to include the password. Open the commands.cfg file for editing.
vi /usr/local/nagios/etc/commands.cfg
Change the definition of the check_nt command to include the “-s <PASSWORD>” argument (where PASSWORD is the password you specified on the Windows machine) like this:
define command{
command_name check_nt
command_line $USER1$/check_nt -H $HOSTADDRESS$ -p 12489 -s PASSWORD -v $ARG1$ $ARG2$
}
Also publicly available services that are provided by Windows machines (HTTP, FTP, POP3, etc.) can be monitored easily by following commands,
A simple service definition for monitoring the HTTP service on the remotehost machine might look like this:
define service{
use generic-service
host_name remotehost
service_description HTTP
check_command check_http
}
A simple service definition for monitoring the FTP server on remotehost would look like this:
define service{
use generic-service
host_name remotehost
service_description FTP
check_command check_ftp
}
A simple service definition for monitoring the SMTP server on remotehost would look like this:
define service{
use generic-service
host_name remotehost
service_description SMTP
check_command check_smtp
}
Save the file.
Then reload the nagios
Category : Linux

Add new commentSIGN IN