Published on: July 19, 2014 by George K.

Scenario:
Server load monitoring is important for better and stable performance of a server, let us see what is meant by Load and how it can be measured,
Load
It is the most useful parameter to identify a server resource bottle necks. Let us look into the ways to identify and interpret it. Load output gives the no. of processes/jobs which waiting to be processed. It can be checked using different tools and the most commonly used in server load monitoring are w, uptime and top
The outputs are shown below
# w

01:30:06 up 87 days, 23 min, 2 users, load average: 13.54, 13.06, 13.48
#top

top - 01:30:44 up 87 days, 24 min, 2 users, load average: 14.18, 13.30, 13.54

Tasks: 707 total, 3 running, 697 sleeping, 0 stopped, 7 zombie

Cpu(s): 31.9%us, 5.7%sy, 0.2%ni, 51.9%id, 10.1%wa, 0.0%hi, 0.2%si, 0.0%st

Mem: 24625092k total, 23494124k used, 1130968k free, 421464k buffers

Swap: 2096440k total, 39756k used, 2056684k free, 11002424k cached
# uptime 01:34:48 up 87 days, 28 min, 2 users, load average: 13.37, 14.22, 13.91
What is load?
Load averages are the three numbers shown in the highlighted values in the above examples. The three load-average values in the first line of top output are the 1-minute, 5-minute and 15-minute average. That means, while on server load monitoring, reading from left to right, one can examine the aging trend and/or duration of the particular system state. Each number represents the average number of processes in the system run queue( process waiting for cpu cycles) in the past 1, 5, and 15 minutes, respectively.
Single Core/CPU system
If a single process sat in the run queue for 5 minutes, the 5 minute load average would be 1. If a single process was in the run queue for 2.5 minutes, the 5 minute load average would be 0.5 , meaning that on average over the past 5 minutes the queue was empty 50% of the time. Whenever a process needs to have instructions executed, it gets sent to the system run queue. The CPU then executes the those processes one at a time; every process in the run queue must wait it’s turn for the CPU. If your system has a large amount of processes all begging for CPU, and your CPU cannot keep up, your system run queue is probably going to become populated. A populated run queue can tell you that your CPU can’t handle all the processes coming at it immediately.
The three values help us to analyze the system performance trends and is quite effective to curb attacks.
Multi core/CPU system
Your system only has one run queue, and every CPU will execute processes in that queue. If you have a system with four CPUs, then up to four processes can be executed in the run queue simultaneously. On multi-processor system, the load is relative to the number of processor cores available. The “100% utilization” mark is 1.00 on a single-core system, 2.00, on a dual-core, 4.00 on a quad-core, etc. For this reason, you have to interpret your load average slightly differently on a system with multiple CPUs. If you have 15-minute load average of 3 and your system has 8 CPUs, an average of 5 CPUs were idle during those 15 minutes.
Identification of CPU cores and Server stability
In server load monitoring it is important to find number of core in the CPU. CPU cores handle the processes. Consider a single core CPU where only 2 process can be handled by a core. When a 3rd process comes it goes to queue. It has to wait until one process is finished. If more cores are available, the processes in the server queue will be shrink and will add more stability to the server.
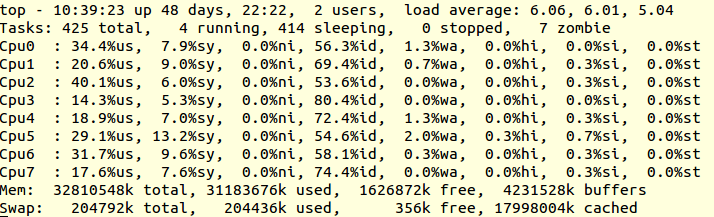
Let us consider a scenario where the server load is reported as : 6.30, 5.90, 5.27 .
To perform the evaluation, the number of CPU cores can be identified using top command. First give “top” command and then press the “1” button in your keyboard, you can see the all the available cores with there stability parameters.
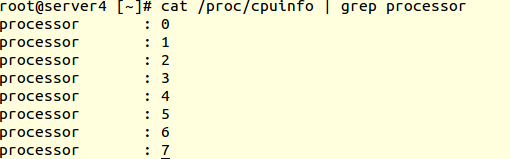
You can also know the number of cpu cores from /proc/cpuinfo.
For easy estimation of the server stability with load you can use the following command
cat /proc/cpuinfo | grep processor | wc -l
The current load on the server is load average: 6.30, 5.90, 5.27. While considering the fact that the server has 8 CPU cores, the current value is not an alarming one.
Category : Linux, Troubleshooting

George started his career in web hosting and Linux technical support in the year 2004 and is with SupportSages since 2009. He has keen interest in server optimizations, custom security solutions, hacked server recovery, cyber forensic and high availability fail over system design and implementation. George loves long drives and is passionate about art and literature.


Add new commentSIGN IN